How to Use Spedsta to Gain Insights into Your Financial Performance

Hello, in this tutorial, I’ll show you how to analyze your financial performance using SPEDSTA’s reporting tools. SPEDSTA offers several reports that let you dive deep into the data, such as the passenger ride history, driver ride history, and organization ride history. These are covered in separate videos. Click HERE for a video walkthrough.
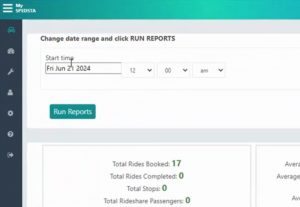
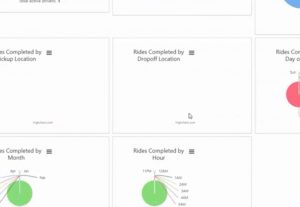
The Enterprise Reporting section is key for detailed analysis. For example, you can run reports for specific time frames to get insights on total rides booked, average pickup and drop-off times, payouts, and more. You’ll also see charts and pie graphs showing types of trips and completed rides.
Another important tool is the All Ride Report. This report provides detailed data on every ride, which you can export or analyze using built-in pivot tables. These reports are crucial for understanding your financial performance and demonstrating your team’s efficiency and accountability.
By using SPEDSTA’s reporting features, you’ll gain valuable insights. Start using these tools today to enhance your financial analysis and showcase your organization’s impact.
Ready to unlock the potential of smarter transportation planning? Book your demo now and explore how our scheduling software can elevate your operations.
ABOUT THE AUTHOR
MIKE B.
Mike is a seasoned transportation consultant and technology advocate. Drawing from years of experience in the transportation industry, Mike bridges the gap between innovative software solutions and practical implementation strategies. His articles focus on the transformative power of software for organizations that deliver transportation options for the elderly, special needs and disabled communities. Outside his writing endeavors, Mike enjoys exploring the landscapes of Costa Rica and advocating for sustainable transportation initiatives.


Recent Comments